


 9 / 84

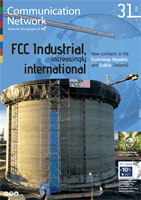
KEY FIGURES
Million Euro
Net sales
EBITDA
Ebitda margin
EBIT
Income attributable to equity holders of the parent company
Net interest-bearing debt
Portfolio
Dec. 15
6.476
814,6
12,6%
323,8
(46,3)
5.473,6
32.499,7
Dec. 14
6.334,1
804
12,7%
(345,6)
(724,3)
5.016
32.996,5
Chg. (%)
2,2%
1,3%
-0,1 p.p
n.a
-93,6%
9,1%
-1,5%
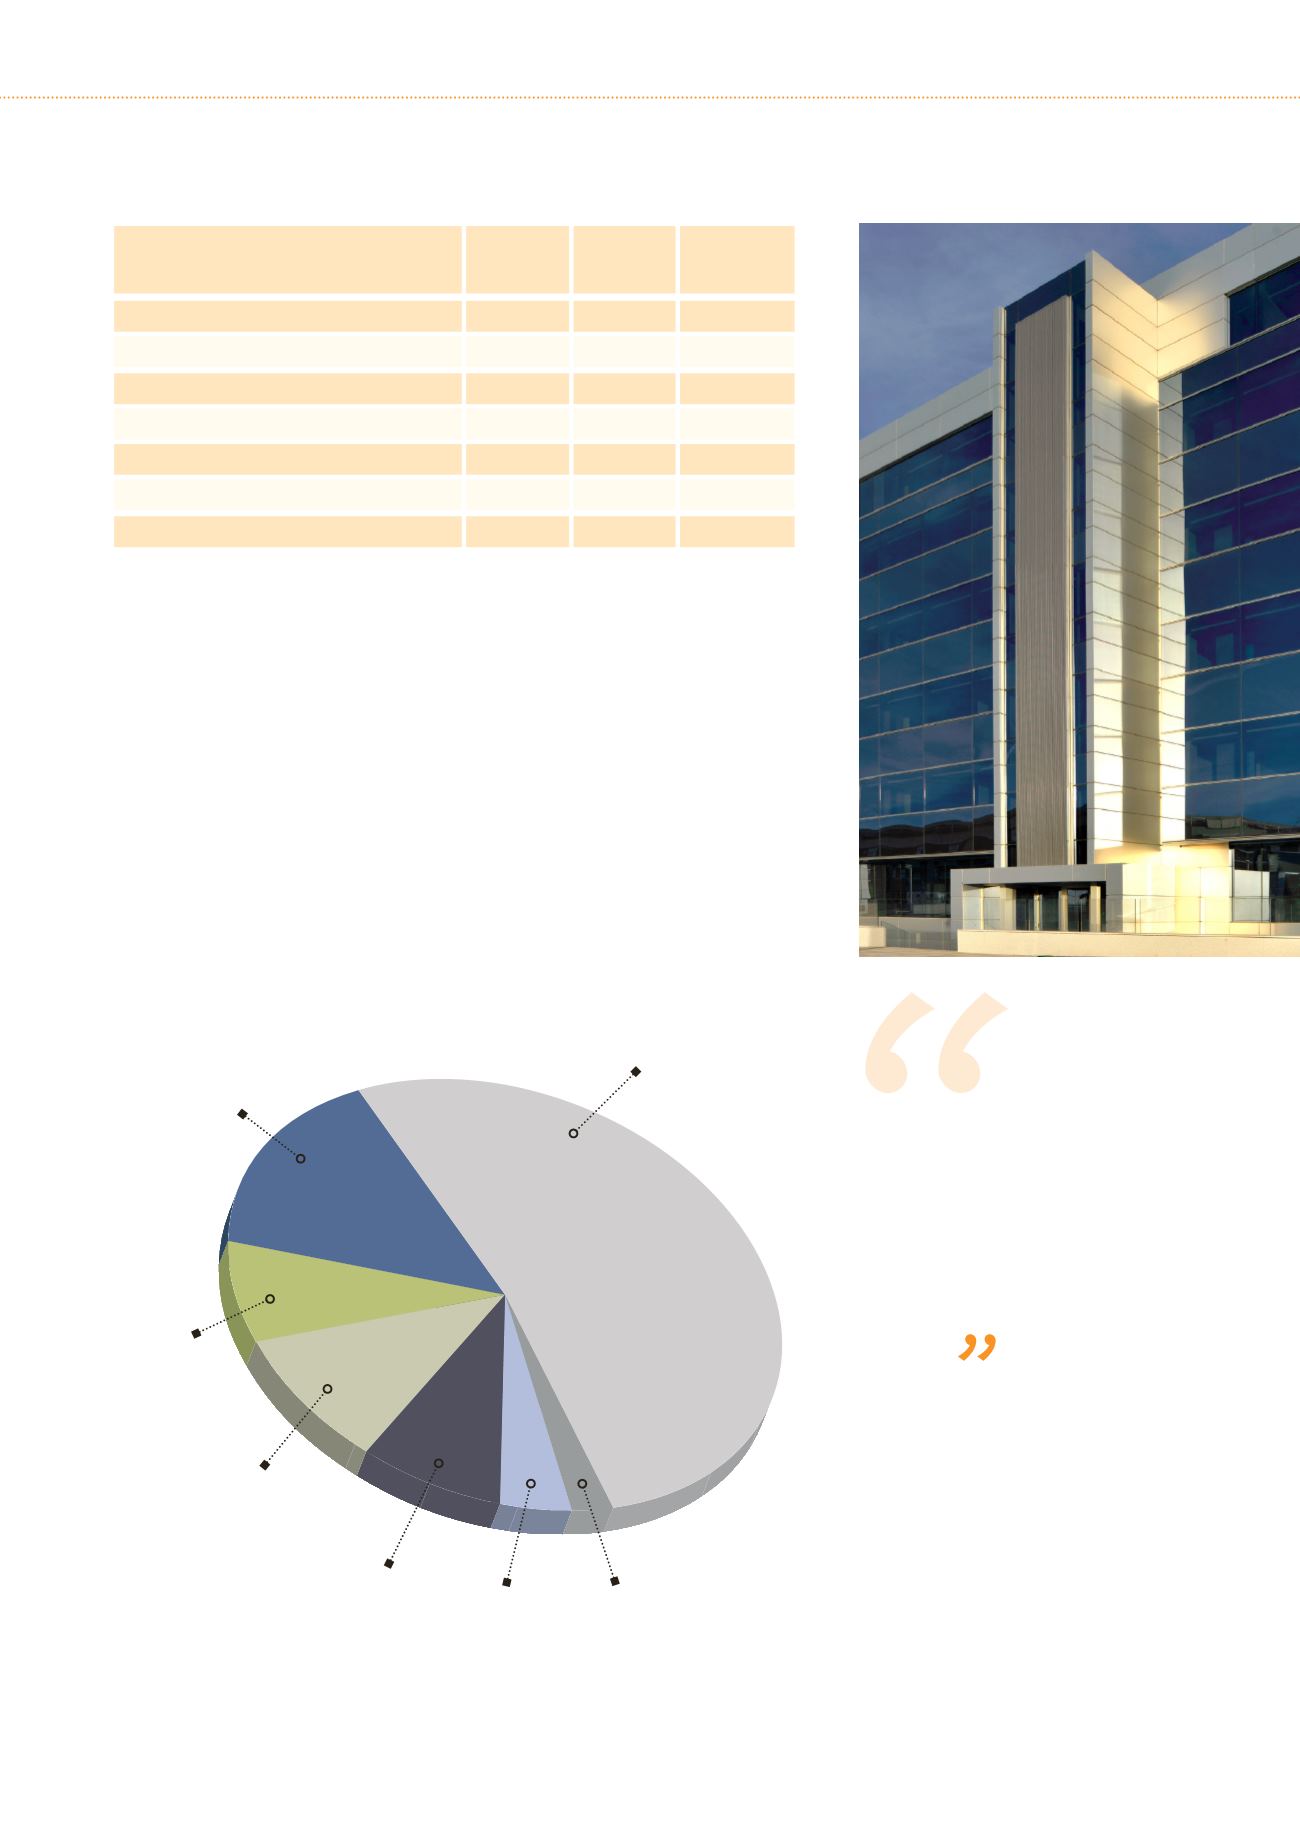
Latin America
7,6%
Central Europe
8,0%
USA and Canadá
4,0%
Others
2,5%
Spain
52,6%
% Revenues by region
Middle E.
and N. Africa
9,4 %
UK
15,9%
remaining 20.7% came from cyclical
activities linked to infrastructure and
building construction.
Net financial debt at 31 December 2015
was 5.4736 billion euros, representing a
decrease of 243.9 million on last September
and an increase of 457.6 million euros with
regard to the year-end 2014. This increase
is largely due to the reclassification of long-
term financial assets in the Construction
area, the effect of the exchange rate on
foreign currency denominated debt and the
reduction in the cash balance.
As regards the business portfolio, the
amount totalled 32.5 billion at year-end
2015, in line with the 32.996 billion at year-
end 2014. These figures Group’s represent
a continuation of historically high levels
seen in recent years. The Water business
represents 44.4% of the total portfolio,
while Environmental Services represents
36.4%, with Construction the remaining
19.2%
Environment and Water
units accounted for 79.3%
of the gross operating profit
(EBITDA) and had positive
net profit